Live data with Chart.js
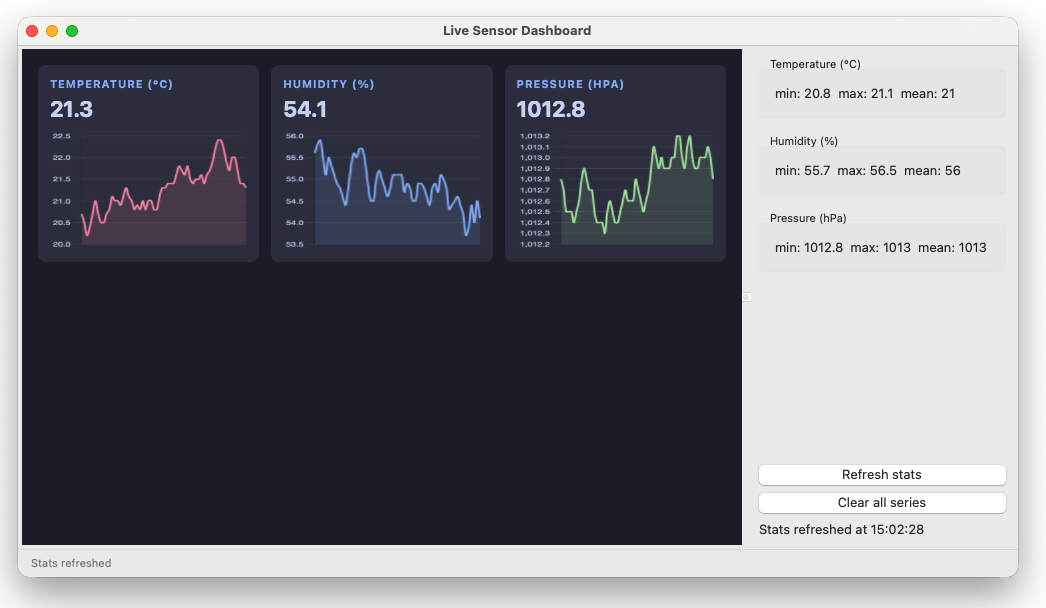
This lesson builds a live sensor dashboard — three Chart.js line charts fed by Ruby timers via JsBridge. It demonstrates the full multi-file pattern applied to a WebView app, with a clean separation between the data model, the WebView panel, and the wx sidebar.
|
|
Requires internet access for the Chart.js CDN.
File structure
live_chart_app/
├── main.rb
├── Gemfile
├── assets/
│   └── js/
│       └── js_bridge_client.js   # JS side of the bridge library
└── lib/
    ├── dashboard_frame.rb
    ├── js_bridge.rb              # Ruby side of the bridge library
    ├── html/
    │   └── dashboard_page.rb     # HTML as a Ruby module
    ├── models/
    │   └── sensor.rb
    └── panels/
        ├── chart_panel.rb
        └── stats_panel.rb
js_bridge.rb and js_bridge_client.js are the bridge library pair from lesson 5.2 — drop them into any WebView app unchanged.
The model — lib/models/sensor.rb
Sensor is pure Ruby — no UI knowledge, no WebView. It holds baseline values and drift parameters for each series, and provides a read(series) method that returns a simulated sensor value with realistic random drift. The frame calls read on every timer tick and passes the result to the chart panel.
The HTML module — lib/html/dashboard_page.rb
The dashboard HTML lives in a Ruby module with a class method that generates the page. It accepts the sensor series configuration from Ruby so the chart colours and labels are consistent between the Ruby and JS sides:
|
|
The JS client library is loaded as a base64 data URI in the page <head>:
|
|
Chart.js is loaded from CDN immediately after:
|
|
The page builds its charts dynamically from the series config — adding or removing a sensor in sensor.rb automatically adds or removes a chart column.
The chart panel — lib/panels/chart_panel.rb
ChartPanel wraps the WebView and JsBridge completely. The frame knows nothing about WebView internals — it calls clean Ruby methods:
|
|
Inside the panel, push_data calls the JS pushDataPoint method via @bridge.call. The chart updates immediately with no animation (chart.update('none')) for smooth live performance.
The ready pattern from lesson 5.2 is applied correctly — Ruby triggers ready after registering the handler:
|
|
The on_ready callback notifies the frame, which then starts the data timer. No data is pushed until the page is ready.
The stats panel — lib/panels/stats_panel.rb
A plain wx panel with static text labels for each series and two buttons — Refresh stats and Clear all. It knows nothing about WebView or JsBridge. The frame wires it up via callbacks following the lesson 3.2 pattern.
The frame — lib/dashboard_frame.rb
The frame is a thin coordinator. Its jobs:
- Create the splitter and both panels
- Start the data timer when the chart panel signals ready
- On each timer tick, read all sensors and push to the chart panel
- On Refresh Stats, call
get_statsfor each series and pass results to the stats panel - On Clear All, clear each series in the chart panel
- Stop the timer on close
The timer runs every 500ms. Each tick reads all three sensors and calls push_data for each. Because JsBridge.call is asynchronous (fire-and-forget for push_data), the timer never blocks — 500ms is plenty of time for the chart to update between ticks.
Querying data back from JS
The Refresh Stats button demonstrates true RPC — Ruby calls a JS method and gets data back:
|
|
The JS getStats method computes min, max, and mean from the chart’s current data array and returns them as a hash. Ruby receives this in the callback and updates the wx labels. This is the same @bridge.call with callback pattern from lesson 5.2 — now applied to real data.
What to take forward
- HTML in a dedicated module keeps the frame clean
js_bridge.rb+js_bridge_client.jsdrop into any WebView app unchanged- The chart panel wraps all WebView/JsBridge details — the frame calls clean Ruby methods
- Never push data until
on_readyfires — guard withreturn unless @ready - Use
chart.update('none')in Chart.js for smooth live updates without animation JsBridge.callwith a callback is the pattern for querying data back from JS
Previous: The JavaScript bridge | Next: Leaflet maps